WHAT ARE THE KEY FEATURES OF ZENIT G-SIGHT?
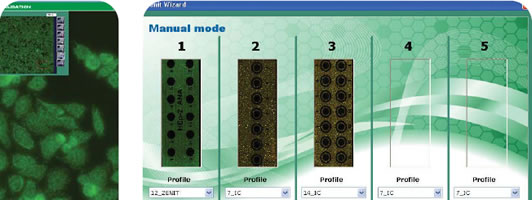
The innovative Zenit G Sight software is the central component of the system. It guarantees optimal image capture and processing, fully automated analysis of immunofluorescence signals and efficient data storage and management. In addition, Zenit G Sight software manages and controls the entire experimental workflow.
DIGITAL IMAGE ACQUISITION
Zenit G Sight software automatically reads out images and generates editable high-resolution Jpeg2000 files (30-50 MB per well). Enlarged images can subsequently be obtained by means of digital magnification.
IMAGE INTERPRETATION / EVALUATION
Zenit G Sight software processes the fluorescence signals and ensures an objective reading: it automatically analyzes signal intensity and distribution in each sample.
A cut-off level was set in order to minimize the risk of “false negatives”. After the positive-negative differentiation step, a mathematical algorithm automatically assigns the observed fluorescence, for example, to one of the five basic patterns in the case of HEp-2 substrate.
The system can also give a semi-quantitative result on a positive identification criteria basis (for the HEp-2 cells, the dsDNA-mAb33 Cat. Number 33300 vial 10000 IU correlated with WHO standard Wo/80 has been used as reference material, to estimate the Absolute concentration/fluorescent emission rate).

SOFTWARE Image storage
Once the manual validation process is completed, Zenit G Sight software proceeds with immunofluorescence image archiving. The system provides sufficient data storage capacity for about 5000 slides*. Data retrieval and sharing
The Zenit G Sight software database search option allows easy retrieval of previous results.
Online data access and exchange are also possible. Workflow management
The intuitive, user-friendly interface of Zenit G Sight software accompanies the operator step by step through the entire autoantibody detection process: |
|
1. Worksheet loading (automatic or manual)** |
|
The worksheet contains the number of slides to process, the test to be carried out for each slide and sample data (for each well: patient identification number, patient details, antibody title etc…). |
2. Scanning and automatic analysis of samples |
|
After slides are placed on the stage, the system automatically acquires images and proceeds to analyze them using a specific algorithm to discriminate between positive and negative samples and assign a pattern to each well. |
3. Validation |
|
The operator examine every digital image and navigate the virtual slide. Moreover the diagnosis provided by the system can be confirmed or modified based on the clinical and laboratory history of the patient. |
4. Report (to print or as an export file) |
|
The system allows report printing and creation of an output worksheet file containing the pattern and associated diagnosis for every well. |
* depends on the HDD capacity;
** Zenit G Sight can be connected to LIS and to all Zenit Series A. Menarini Diagnostics liquid handling systems for the automatic preparation of IIF slides